
The Definitive Guide to Google Analytics: How Businesses Can Use Data to Improve Their Websites
In the digital world, your website is often the first and most important interaction a potential customer has with your business. But how do you know if it's working? Are visitors finding what they need? Where are they coming from, and what makes them leave? This is where Google Analytics (GA) comes in.
It's not just about counting page views. It's about understanding user behavior to make informed decisions that drive growth. This guide will walk you through the essentials of the latest version, Google Analytics 4 (GA4), and show you how to turn data into actionable improvements for your site.
Getting Started with Google Analytics 4 (GA4)
GA4 is the new standard, designed to give you a more complete picture of the customer journey across devices. Unlike its predecessor, which focused on sessions, GA4 is built around "events" – any interaction a user has with your site, from a page view to a button click.
When you first log in, you'll be greeted by the Home dashboard, which provides a high-level overview of your site's performance. It's your central hub for monitoring key metrics at a glance.
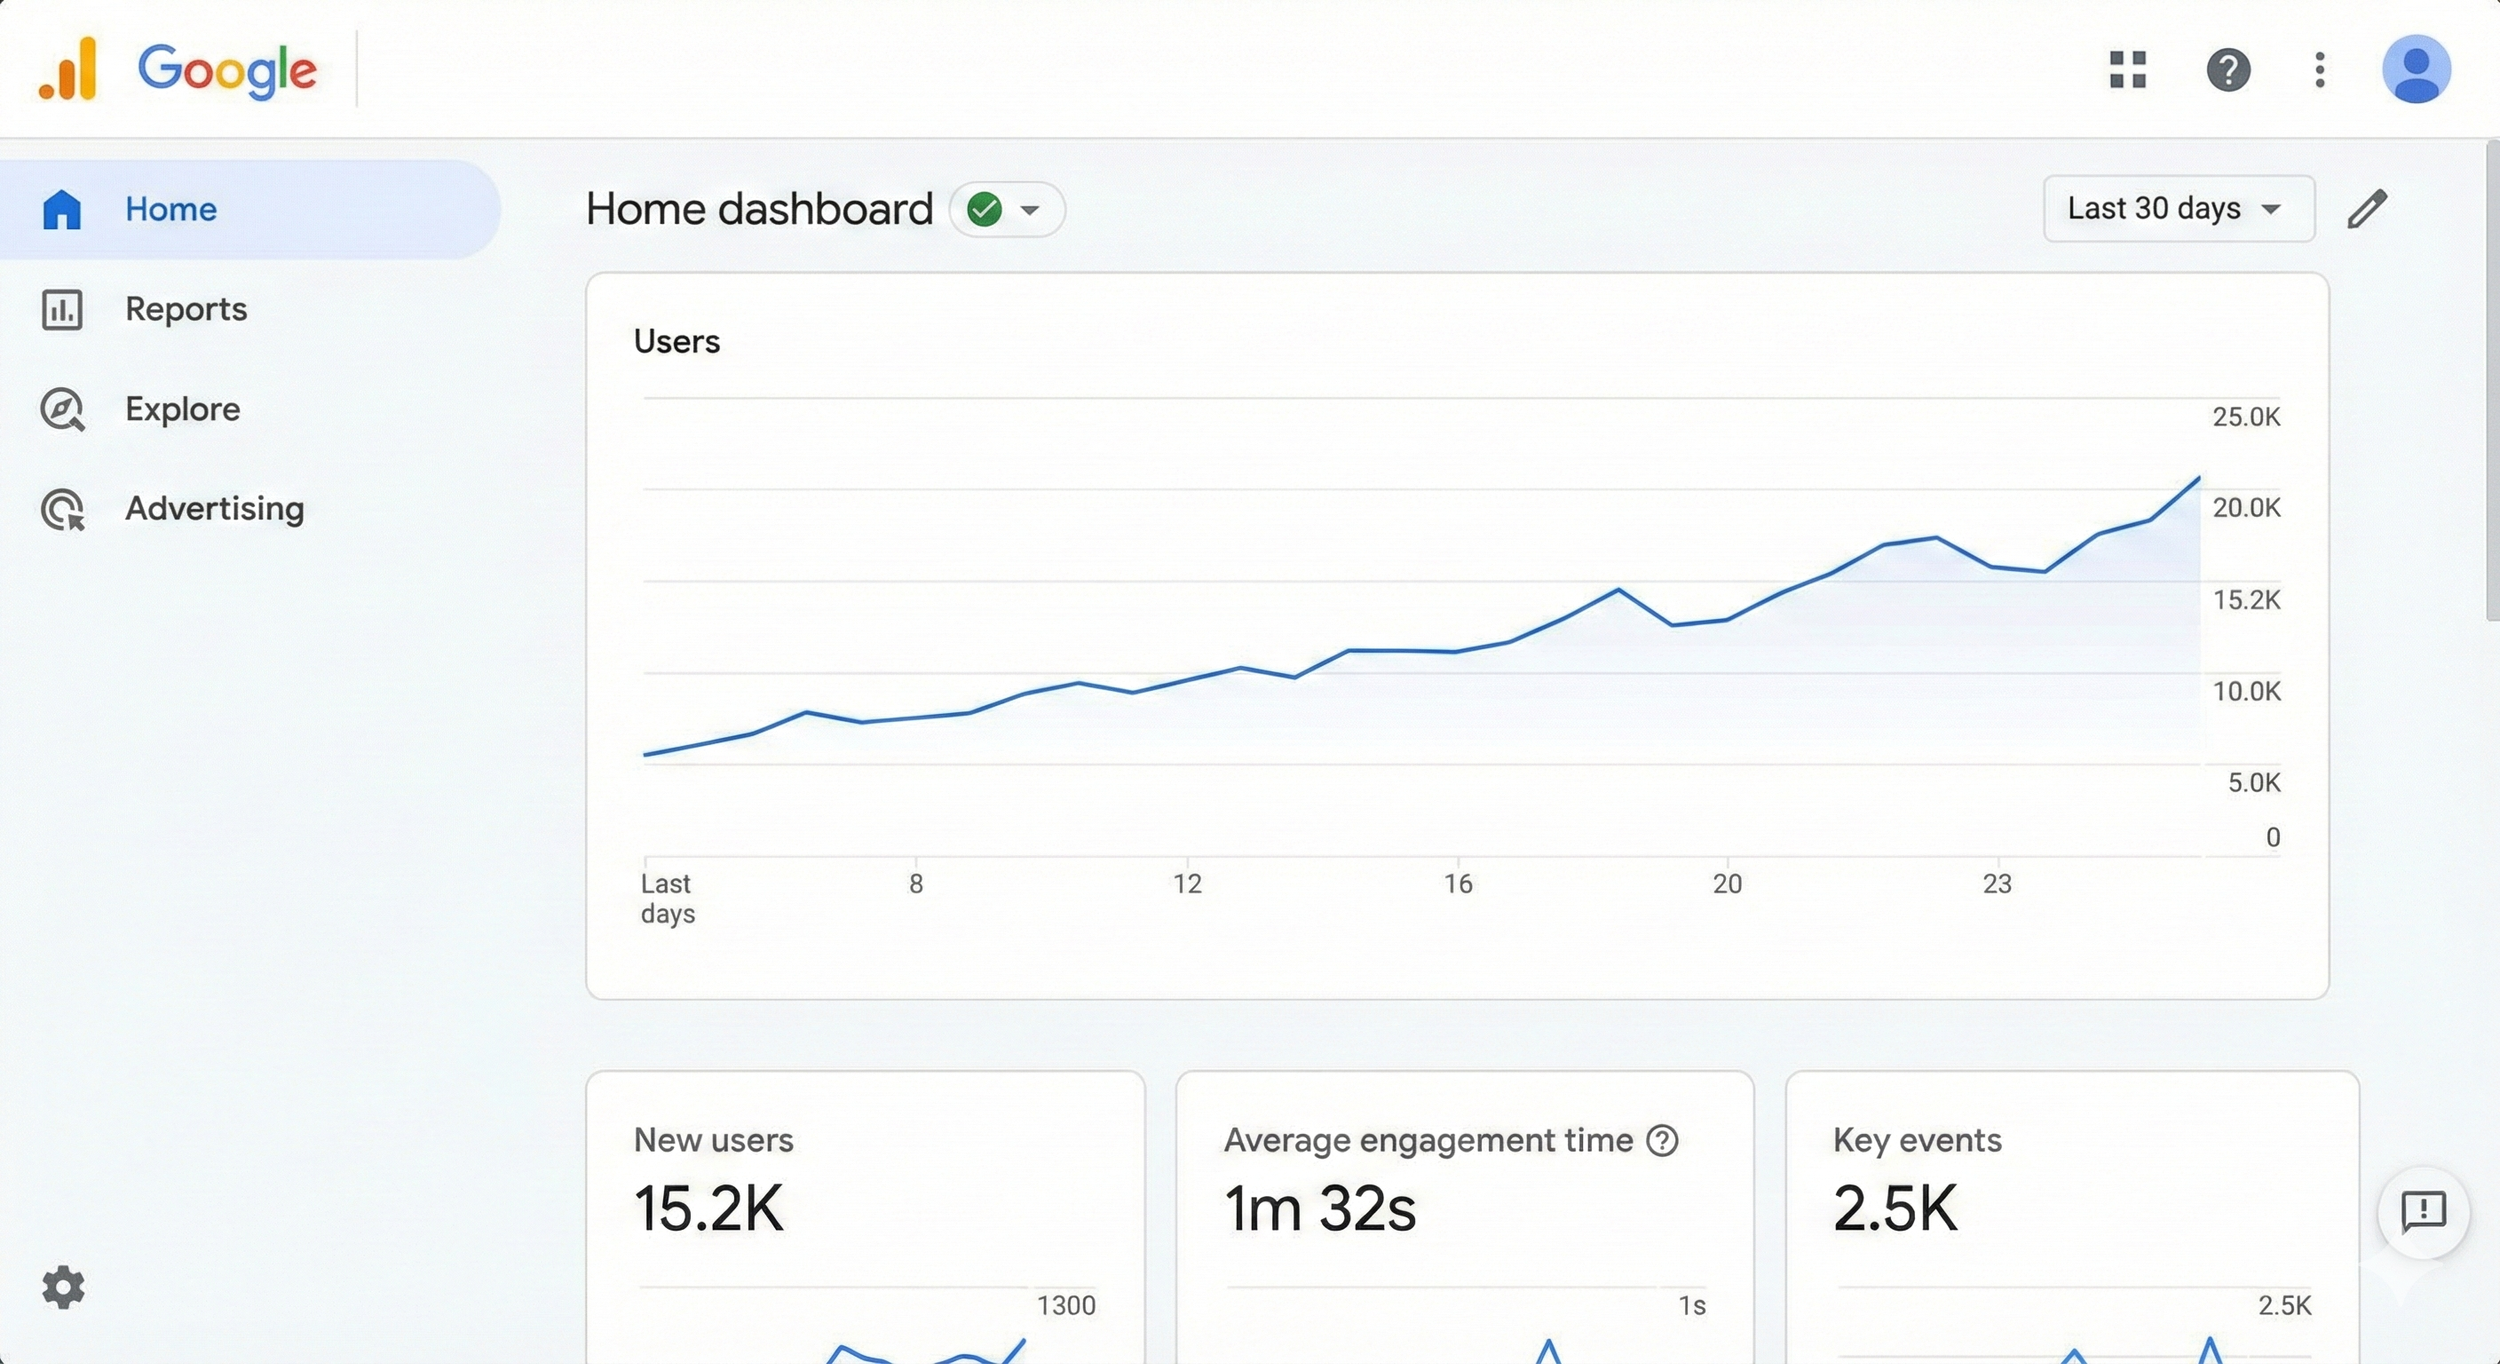
Figure 1: The Google Analytics 4 (GA4) Home Dashboard gives you a quick snapshot of your site's traffic, user engagement, and key events.
As shown in the dashboard above, you can immediately see trends in your user base, how long they're spending on your site, and how many are completing important actions ("Key events"). This is your starting point for digging deeper.
Key Areas to Analyze for Website Improvement
To make meaningful improvements, you need to focus on the right metrics. Here are the key areas every business should track:
1. Acquisition: Where Are Your Visitors Coming From?
Knowing how people find your site is crucial for optimizing your marketing efforts. The Acquisition reports in GA4 break down your traffic by source (e.g., Google, Facebook) and medium (e.g., organic, cpc, referral). This tells you which channels are working and where you should invest more resources.
For example, if you see that "Organic Search" is your top traffic source, it means your SEO efforts are paying off. If "Paid Search" is driving a lot of traffic but few conversions, you might need to refine your ad targeting or landing pages.
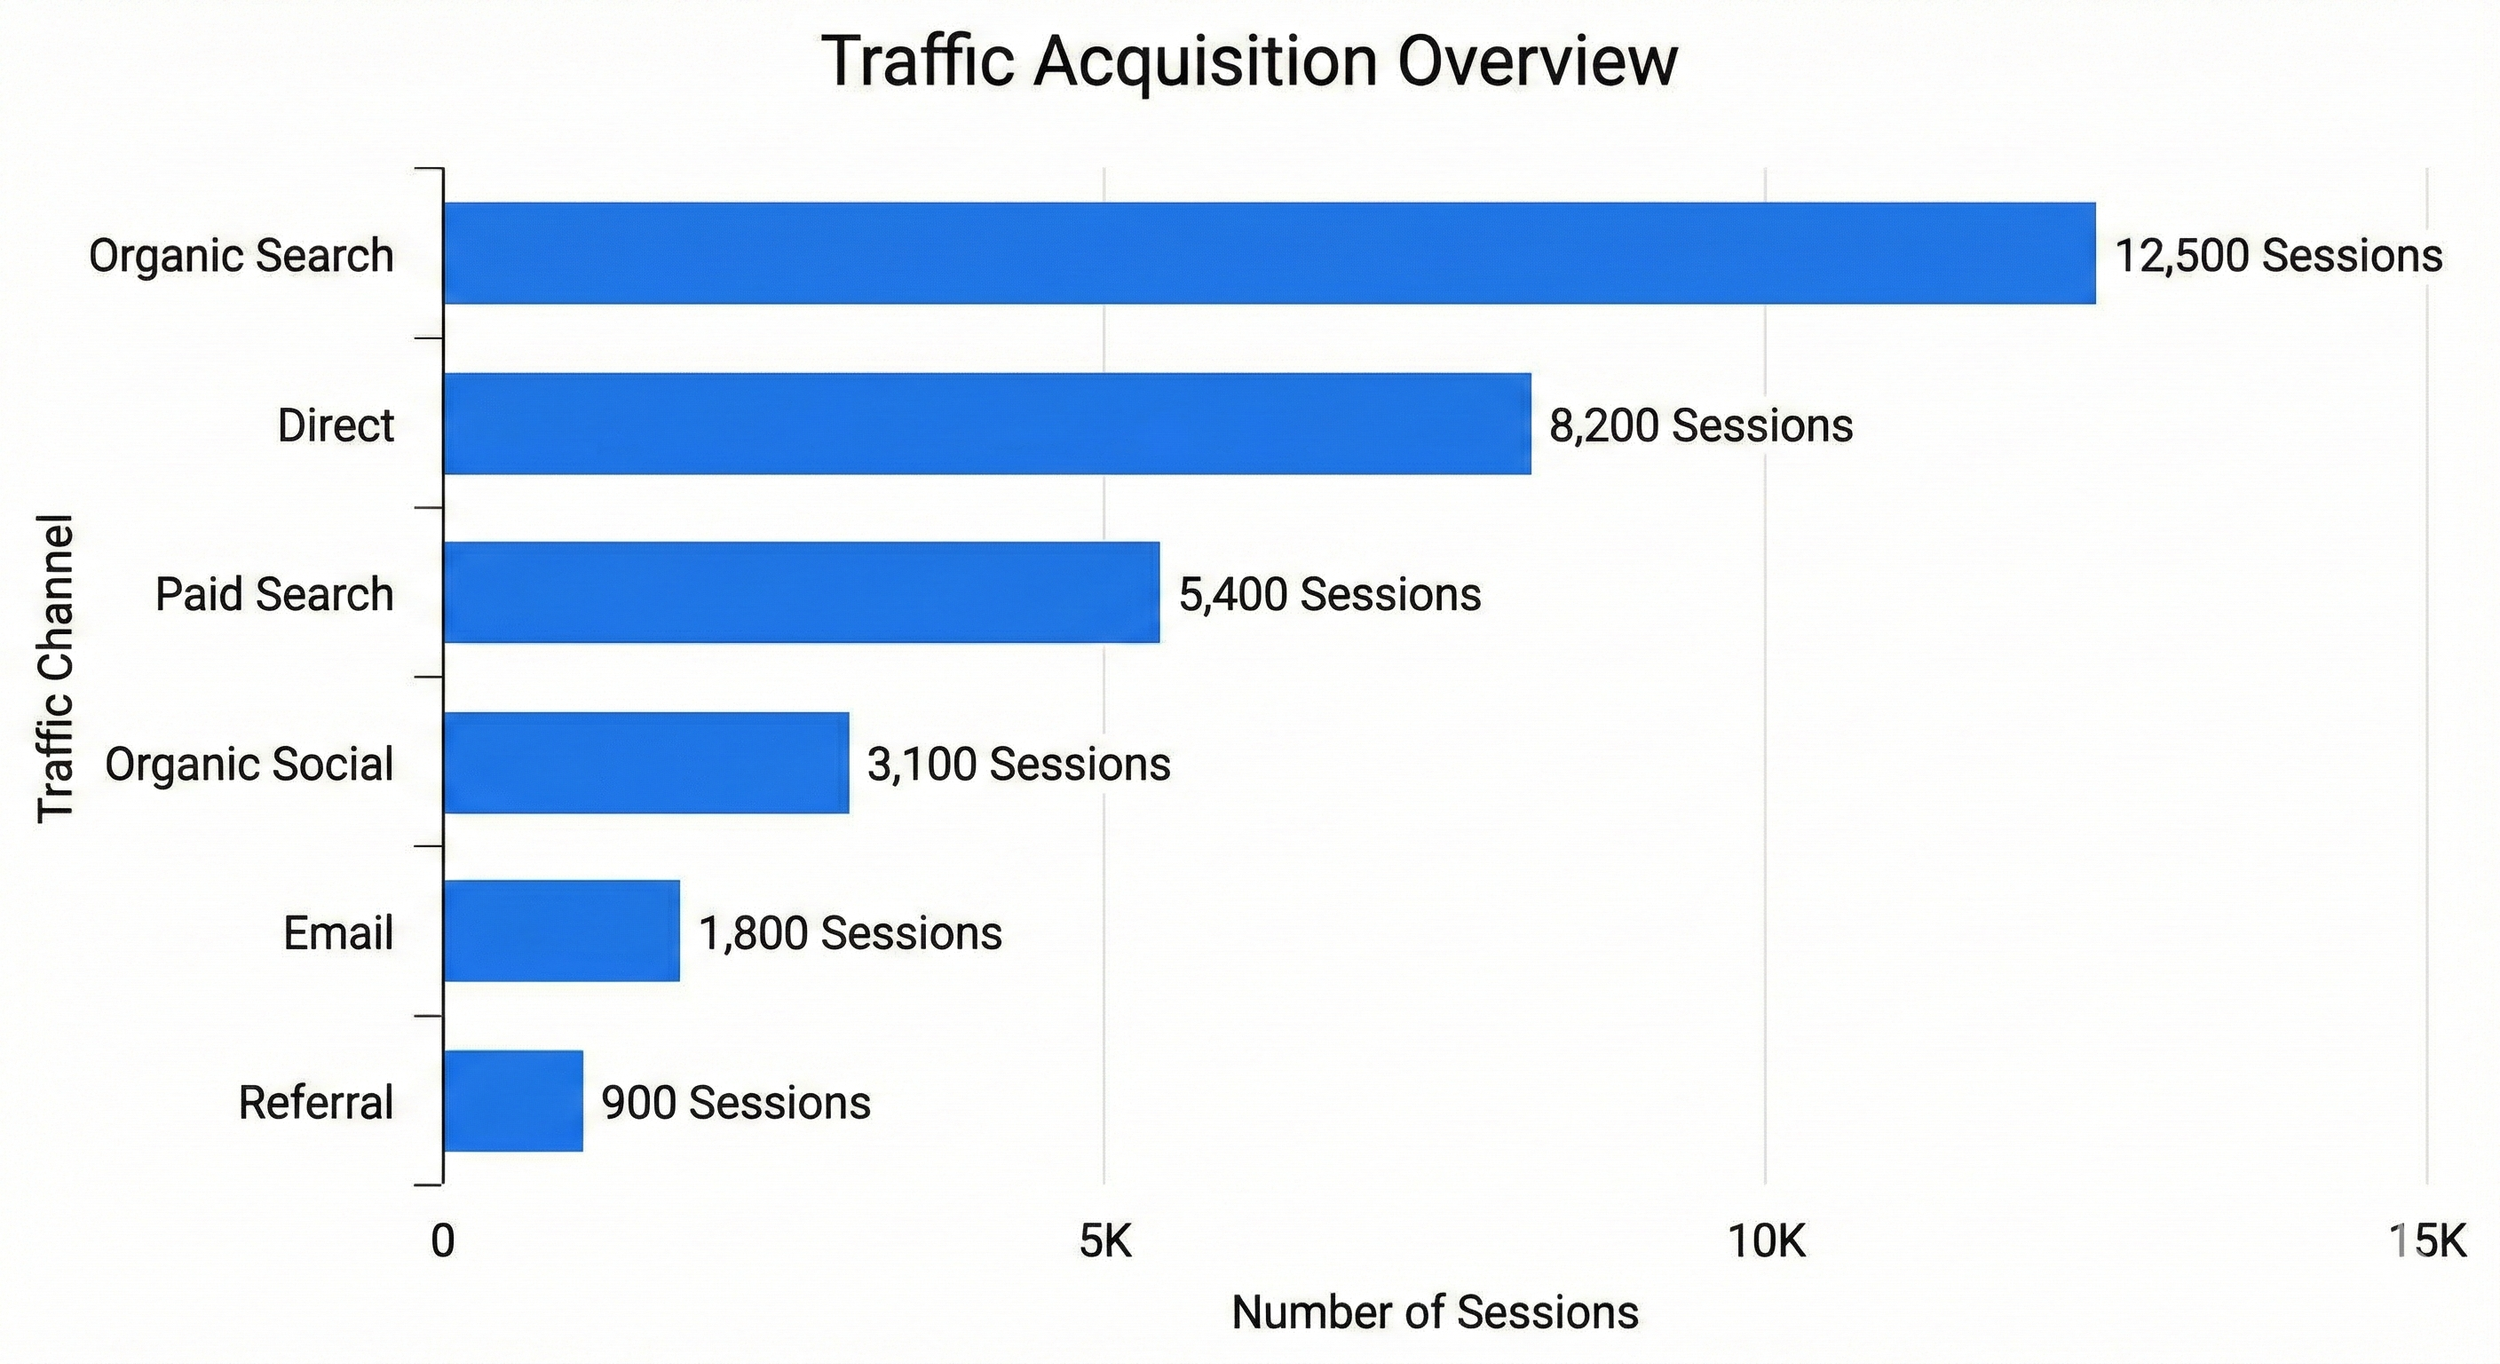
Figure 2: This chart visualizes a hypothetical website's traffic sources, showing that Organic Search is the primary driver of sessions.
2. Engagement: Are Visitors Interested in Your Content?
In GA4, "Bounce Rate" has been replaced with more meaningful metrics like Engagement Rate and Average Engagement Time.
Engagement Rate: The percentage of sessions that lasted longer than 10 seconds, had a conversion event, or had at least two page or screen views. A low engagement rate indicates that users are leaving without finding what they're looking for.
Average Engagement Time: The average amount of time the app or website was in focus in a user's browser.
Use these metrics to identify pages with low engagement. Are they confusing? Is the content not relevant? Is the page loading too slowly? These are all areas for improvement.
3. Conversions: Are Visitors Taking Action?
The ultimate goal of most business websites is to drive conversions – whether that's making a purchase, filling out a lead form, or signing up for a newsletter. In GA4, these are called Key Events.
By marking specific events as "Key Events," you can track how many users are completing these important actions. You can then analyze the path they took to get there. This is often visualized as a conversion funnel, showing the drop-off at each step of the process.
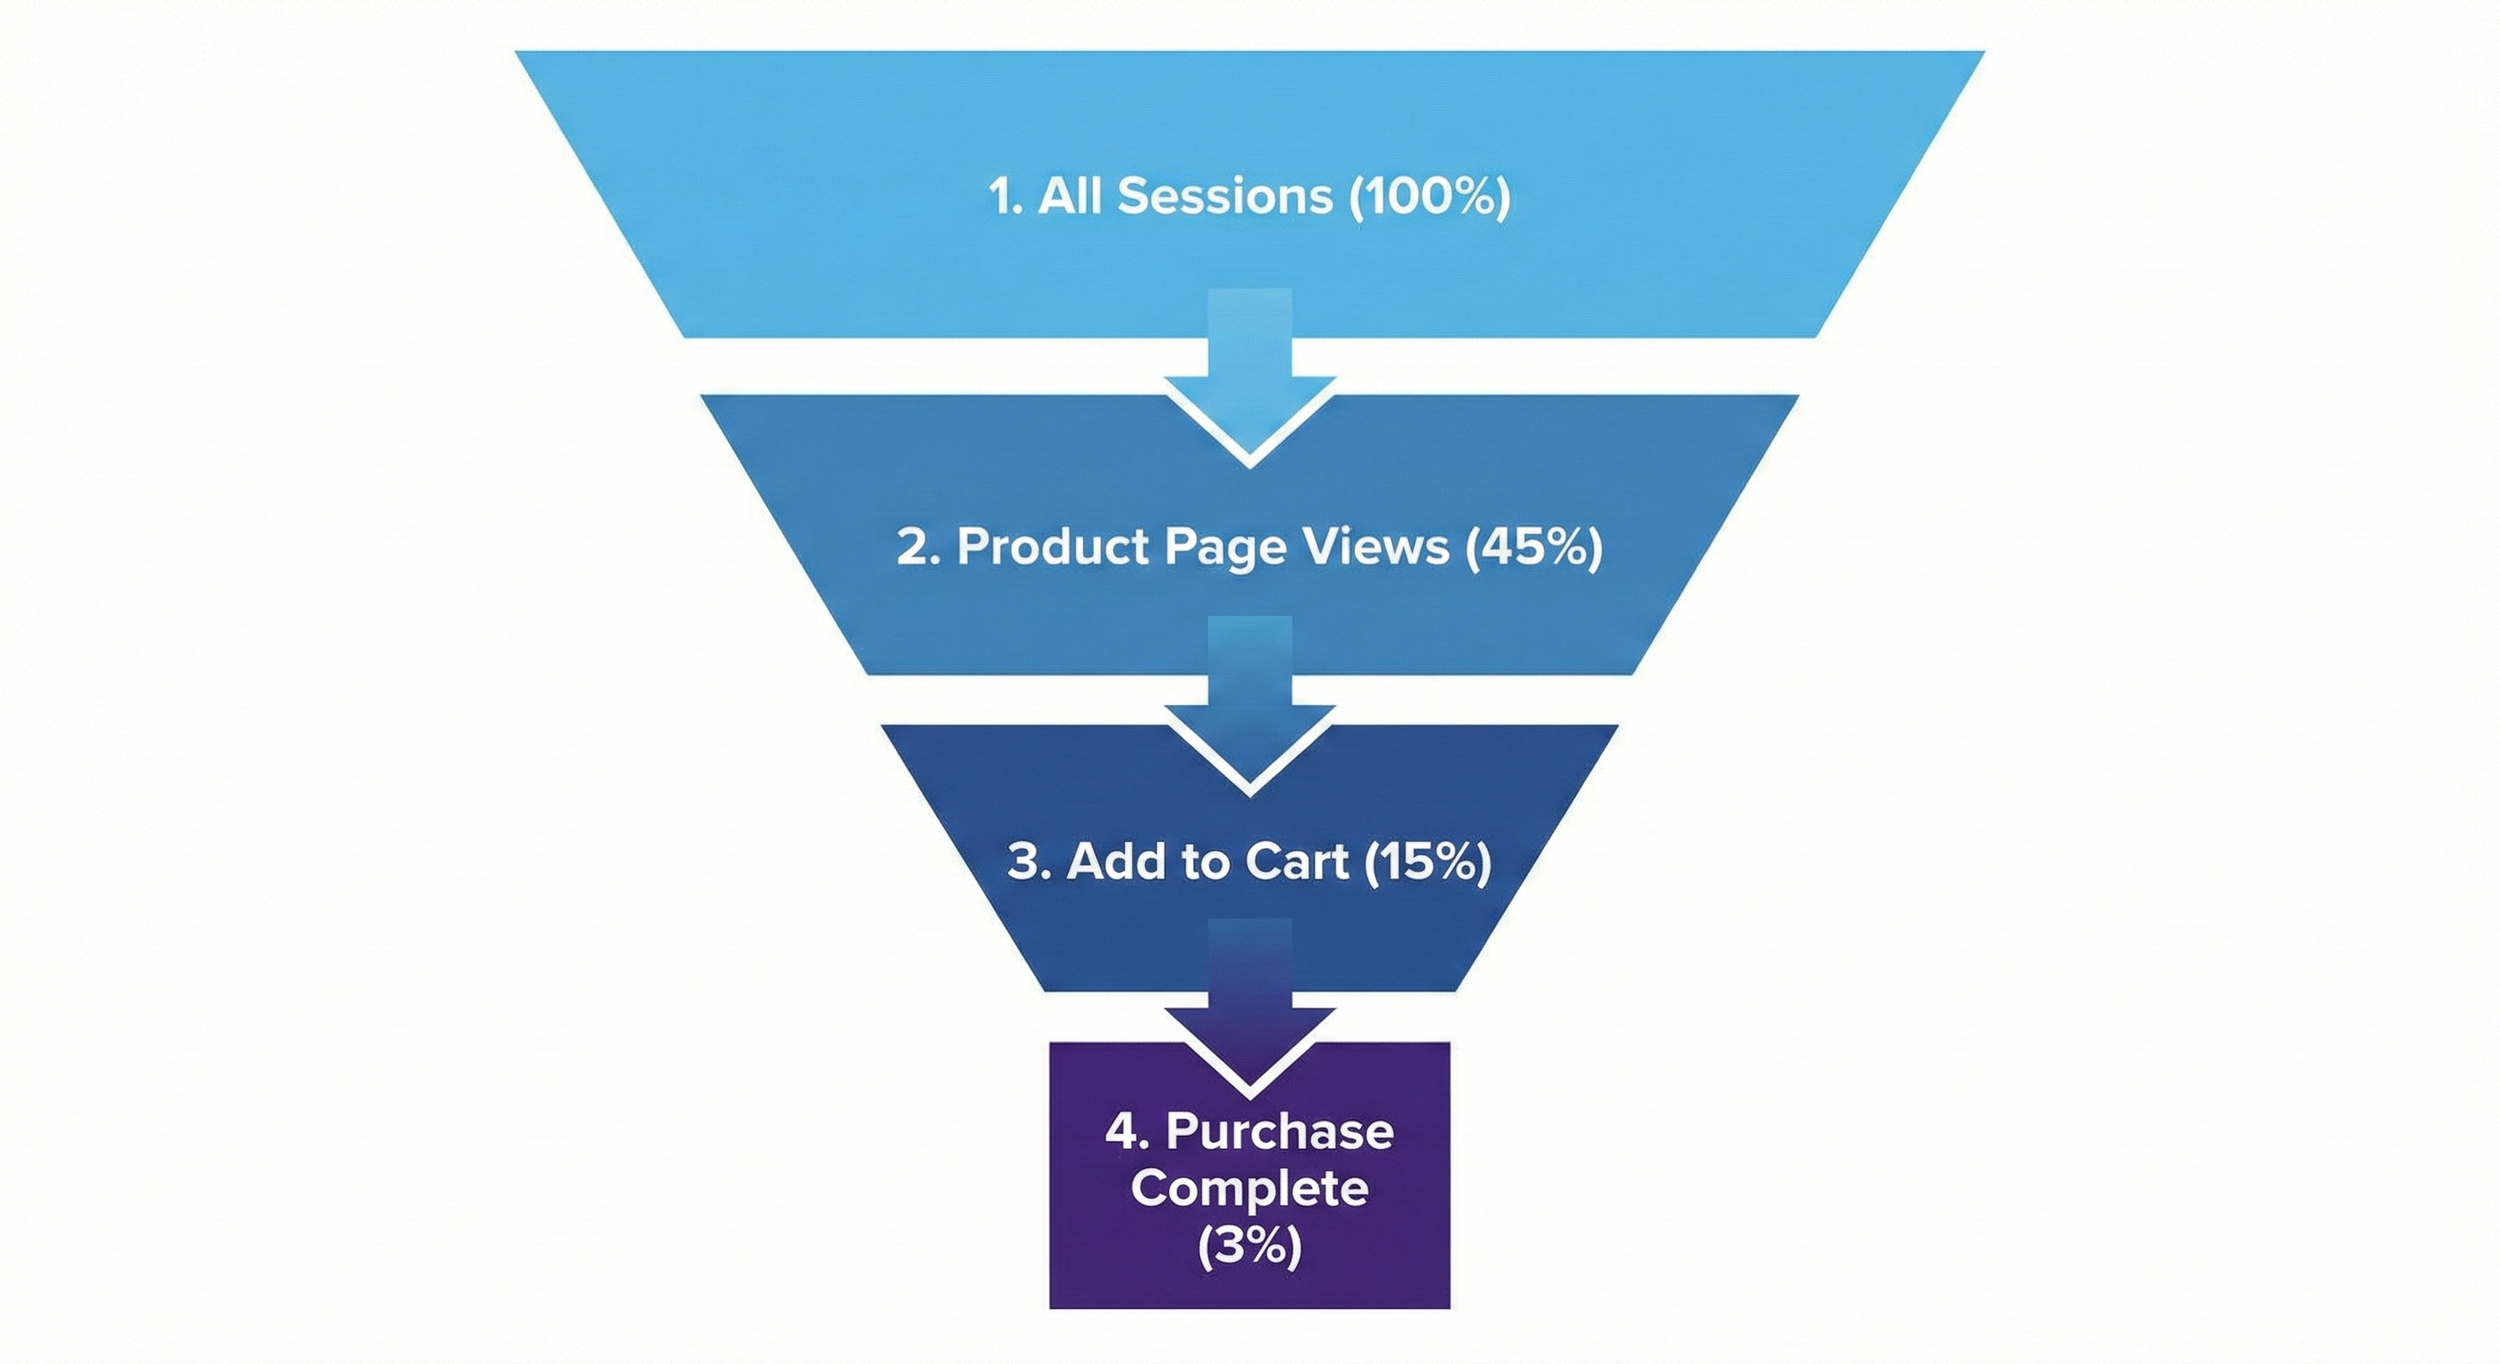
Figure 3: A conversion funnel visualizes the customer journey, showing where you lose potential customers. In this example, there's a significant drop-off between viewing a product and adding it to the cart.
Analyzing your funnel can reveal critical bottlenecks. For example, if a lot of users are adding items to their cart but not completing the purchase, you may need to simplify your checkout process or offer better shipping options.
Turning Data into Action: A Continuous Process
Website improvement is not a one-time project; it's an ongoing cycle of measuring, analyzing, and testing.
Set Clear Goals: Define what success looks like for your website. Is it more sales? More leads? Higher engagement?
Track the Right Metrics: Configure GA4 to track the events and conversions that align with your goals.
Analyze Performance: regularly review your reports to identify trends, patterns, and areas for improvement.
Test and Optimize: Use your insights to make changes to your site – from tweaking headlines to redesigning entire pages.
Repeat: Continue to monitor performance and refine your strategy based on new data.
Need Help Making Sense of Your Data?
Google Analytics is a powerful tool, but it can be overwhelming. Interpreting the data and knowing exactly what changes to make requires expertise and experience.
Our team of digital marketing experts can help you set up GA4 correctly, define the right KPIs for your business, and provide actionable insights to improve your website's performance and drive real business growth.
Ready to unlock the full potential of your website? Contact us today for a free consultation and let's start turning your data into results.